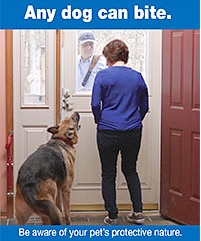
SAN DIEGO — The number of postal employees attacked by dogs nationwide reached 6,244 in 2017 — more than 500 fewer than 2016. Today, the U.S. Postal Service (USPS) is showcasing technology that alerts mail carriers of potential attacks while releasing its annual list of cities where they recorded most dog attacks. The organization also highlights safety initiatives to help protect its employees and offers tips to pet owners.
“We’re encouraged by the decrease in dog attacks,” said U.S. Postal Service Safety Director Linda DeCarlo in San Diego, where postal employees suffered 46 attacks — the fifth-ranked city in 2017. “The totals are still too high, but we’re confident that with continuing education and dog bite prevention training, along with advancing technology, we can keep more people safe and keep attacks trending downward.”
Enhancing Employee Safety
DeCarlo highlights USPS safety measures that alert mail carriers to dogs on their delivery routes. The Package Pickup application on usps.com asks customers to indicate if there are dogs at their addresses when they schedule package pickups. Carriers receive this information on their delivery scanners which send alerts if someone reports an unleashed dog in a delivery area.
“The scanners that our carriers use to confirm a customer’s delivery include a feature for them to indicate the presence of a dog at an individual address,” said DeCarlo. “This information is particularly helpful for substitute carriers who fill in for regular carriers on their days off.”
| Office City |
Office State |
CY-17 |
CY-16 |
|
|
1 |
HOUSTON |
TX |
71 |
62 |
|
2 |
LOS ANGELES |
CA |
67 |
80 |
|
3 |
ST LOUIS |
MO |
52 |
31 |
|
4 |
CLEVELAND |
OH |
49 |
60 |
|
5 |
SAN DIEGO |
CA |
46 |
57 |
|
6 |
BALTIMORE |
MD |
44 |
36 |
|
6 |
SAN ANTONIO |
TX |
44 |
42 |
|
7 |
COLUMBUS |
OH |
43 |
39 |
|
8 |
DALLAS |
TX |
40 |
41 |
|
9 |
LOUISVILLE |
KY |
39 |
51 |
|
10 |
CHICAGO |
IL |
38 |
46 |
|
11 |
DENVER |
CO |
35 |
47 |
|
12 |
LONG BEACH |
CA |
32 |
22 |
|
12 |
DETROIT |
MI |
32 |
48 |
|
12 |
KANSAS CITY |
MO |
32 |
30 |
|
13 |
OAKLAND |
CA |
28 |
23 |
|
13 |
SEATTLE |
WA |
28 |
31 |
|
14 |
MINNEAPOLIS |
MN |
27 |
43 |
|
14 |
CHARLOTTE |
NC |
27 |
33 |
|
14 |
PHILADELPHIA |
PA |
27 |
40 |
|
15 |
SAN JOSE |
CA |
26 |
21 |
|
15 |
FORT WORTH |
TX |
26 |
33 |
|
16 |
MIAMI |
FL |
25 |
15 |
|
16 |
INDIANAPOLIS |
IN |
25 |
44 |
|
16 |
ROCHESTER |
NY |
25 |
11 |
|
16 |
CINCINNATI |
OH |
25 |
24 |
|
16 |
TOLEDO |
OH |
25 |
18 |
|
17 |
PHOENIX |
AZ |
24 |
35 |
|
17 |
SACRAMENTO |
CA |
24 |
30 |
|
17 |
PORTLAND |
OR |
24 |
41 |


 EastTexasRadio.com Powered by Ten Stations


