


Students in the math models and business management classes at North Lamar High School have been working together on a project assigned by their teachers, Glynese McNabb and Jan Bell. While one class was responsible for coming up with the questions and conducting the survey, the other class was responsible for finding the best chart or graph to display the graphical data.
An average of 583 math students representing a large sampling of the high school was asked the following multiple choice questions: What would you rather be? Which season is your favorite? What’s your favorite type of food? What’s your favorite type of movie? How do you like to spend your spare time? How much time do you spend on school-related activities outside of school? What is your favorite holiday? What’s your favorite social media?
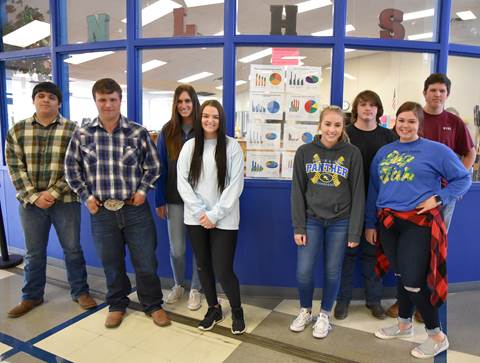
Together the two classes tallied the findings then created the graphs or charts deemed appropriate for the type of data collected. The outcome of the project showed the students’ ability to collect, organize, and represent data. The results of the student survey can be viewed in the foyer of the high school or on the website at http://schools.northlamar.net/upload/page/0116/docs/2018%20Student%20Survey.pdf/